Bank of Ameri2026-09-29 03:46:54BofA says bond-market volatility is testing the AI bull trade as deleveraging risk risesBank of America strategist Michael Hartnett said sharp swings in the U.S. Treasury market are becoming a new source of pressure for risk assets. He pointed to the MOVE Index, which jumped about 35% in two trading days, as a sign that the funding system built around Treasuries as core collateral is facing heavier stress. Hartnett said a broader risk-off deleveraging phase could emerge if the iShares Global Financials ETF, or IXG, falls below $125 while the MOVE Index stays above 125. According to Hartnett, that setup would put the AI trade under a tougher rate test. He said rising yields alone do not automatically end risk appetite, but the combination of elevated yields and weakening financial stocks would be more dangerous because it would suggest rates are no longer signaling economic expansion and are instead tightening liquidity and credit conditions. BofA also noted that the 10-year U.S. Treasury yield briefly moved above 5.2% last week, its highest level since 2007, while an earlier fund manager survey from the bank showed that a disorderly rise in bond yields had overtaken an AI bubble as the market’s top tail risk concern.20
Deutsche Bank2026-09-28 06:45:25Deutsche Bank says tech rotation still has room as positioning remains below June peakDeutsche Bank said in a Sept. 25 investor positioning and flow report that the tech rotation still has room to run, even after a 14% gain since late July and a fresh record high. Over the same period, the rest of the S&P 500 fell 3%, underscoring a sharp split inside the broader market. The bank’s main argument rests on positioning. Tech exposure is elevated at 0.8 standard deviations, or the 80th percentile, but still well below the early-June peak near 2 standard deviations and the 99th percentile. Chief strategist Binky Chadha said aggregate large-cap positioning sits at the 79th percentile, systematic strategies have climbed to the 91st percentile, while discretionary investors remain at the 64th percentile despite strong earnings growth. Deutsche Bank identified rate volatility as the key variable for further buying. It said discretionary positioning has a negative 89% correlation with the MOVE Index, and argued that falling rate volatility would be the condition for renewed additions. The report also showed a split in fund flows through the week ended Sept. 23, with $10.2 billion leaving equity funds, $17.3 billion entering bond funds, and $11.6 billion flowing into money market funds. Deutsche Bank kept its 2026 S&P 500 target at 8,000, with EPS forecasts of $358 for 2026 and $420 for 2027.10
Deutsche Bank2026-09-28 04:00:59Deutsche Bank says tech positioning remains below prior peak as lower rate volatility could unlock more buyingDeutsche Bank said in a Sept. 25 investor positioning and flows report that the rotation into technology stocks still has room to run, even after a 14% gain since late July and a fresh record high for the group. Over the same period, the rest of the S&P 500 fell 3%, according to the report cited by TechFlowPost. The bank’s core argument is that positioning remains uneven. Tech exposure has risen to 0.8 standard deviations, or the 80th percentile, which signals a clear overweight, but it is still well below the early-June peak near 2 standard deviations and the 99th percentile. Chief strategist Binky Chadha said overall large-cap positioning sits at the 79th percentile, while systematic strategies have climbed to the 91st percentile, leaving them more exposed to volatility shocks. By contrast, discretionary investors remain less extended at the 64th percentile. Deutsche Bank said that group’s positioning has a negative 89% correlation with the MOVE Index, a gauge of bond-market volatility, and argued that falling rate volatility is the key condition for further buying. The report also showed mixed fund flows, with equity funds posting a $10.2 billion outflow in the week through Sept. 23 while bond funds took in $17.3 billion. Deutsche Bank kept its 2026 S&P 500 target at 8,000 and its EPS forecasts at $358 for 2026 and $420 for 2027.20
U.S. Treasuri2026-09-28 02:04:14MOVE Index Jumps 19% as U.S. Treasury Volatility Nears Crisis-Level StressU.S. Treasury market volatility has climbed to historically elevated levels, according to a Sept. 28 report from BlockBeats. The MOVE Index, a widely watched gauge of Treasury volatility often described as the bond market’s version of the VIX, rose 19% last week. That marked its biggest weekly increase since “Liberation Day” in April 2025 and the third-largest one-week gain since the 2022 bear market. At the same time, Treasury yields moved sharply higher. The 10-year U.S. Treasury yield rose 17 basis points over the week to 5.17%, its highest level since June 2007. The 30-year yield climbed 16 basis points and moved above 5.50% for the first time since June 2004. BlockBeats said current Treasury trading conditions are showing volatility close to crisis levels. For comparison, during the week of March 17, 2023, the MOVE Index surged 29% after the U.S. banking crisis led to the successive failures of three regional banks.20
Policy Regula2026-09-26 09:56:45Treasury volatility jumps while Bitcoin DVOL slips toward its yearly lowU.S. Treasury volatility surged over two trading sessions, but Bitcoin options pricing moved the other way. According to data cited from the U.S. Treasury and Deribit, the ICE BofA MOVE Index climbed from 78.56 on Sept. 22 to 104.58 on Sept. 24, a gain of about 33% and its highest level since March 30. Over the same stretch, Deribit’s Bitcoin Volatility Index, or DVOL, fell from 37.4 to 36.04, then dropped again to around 34.3 by the evening of Sept. 26 Taipei time, close to this year’s low of 33.59 set on Sept. 17. The report said the Treasury sell-off was driven by a sharp rise in yields. The 10-year U.S. Treasury yield rose from 4.96% on Sept. 22 to 5.18% on Sept. 24, up 22 basis points in two days, before easing to 5.17% on Sept. 25. The 30-year yield moved from 5.29% to 5.47% over the same period and then reached 5.49% on Sept. 25. Meanwhile, Bitcoin’s 30-day realized volatility was about 42%, above the 34.3 implied by options, suggesting actual price swings have been larger than what the options market is pricing in.20
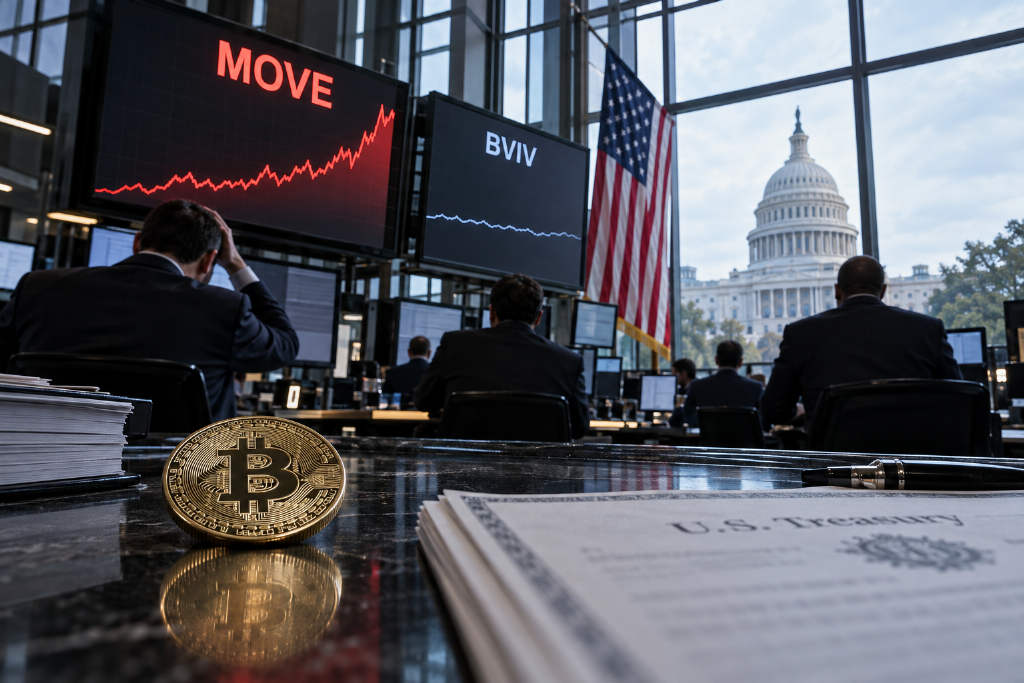
bond market2026-09-26 05:57:30Bond volatility jumps to 104 while Bitcoin options stay near yearly lowsGlobal bond traders are paying up for protection against sharper rate swings, but Bitcoin options traders have yet to follow. The ICE BofA MOVE Index, a gauge of expected U.S. Treasury volatility, climbed to 104.58 from 78.56 on Sept. 22, a roughly 33% jump in two trading days and its highest reading since March. Over the same stretch, Volmex’s 30-day Bitcoin implied volatility index, BVIV, stayed around 37, not far from its yearly low near 35. The divergence has become more visible in cross-market data. Over the past 20 trading days, the correlation between MOVE and BVIV fell to about -0.37, suggesting that rising stress in rates has not translated into higher implied volatility in Bitcoin options. MOVE’s correlation with the equity VIX also slipped to about -0.06, the first mildly negative reading since April 2024. U.S. Treasury yields moved higher as well. According to U.S. Treasury data, the 10-year yield rose from 4.96% on Sept. 22 to 5.18% on Sept. 24, while the 30-year yield increased from 5.29% to 5.47%. Bitcoin, by contrast, was still trading near $84,000 as of Sept. 26, with options pricing showing limited expectations for an extreme move over the next month.20
U.S. Treasuri2026-09-25 11:58:48Treasury volatility climbs while Bitcoin and U.S. stocks stay subduedVolatility in the U.S. Treasury market has risen sharply even as Bitcoin and U.S. equities remain relatively calm, according to a ChainCatcher report. The MOVE Index, which tracks expected Treasury volatility, climbed from about 80 on Tuesday to 104 on Thursday, its highest level since March. At that time, the index had briefly reached 199. In contrast, the Volmex 30-day Bitcoin implied volatility index, or BVIV, was around 37, close to its yearly low of 35, while the Cboe VIX, which measures expected volatility for the S&P 500, was also near its yearly low at 14. U.S. 10-year Treasury yields touched 5.2% on Thursday before easing back to 5.163%. Over the past 20 trading days, the correlation between the VIX and MOVE fell to -0.06, turning negative for the first time since April 2024. The correlation between BVIV and MOVE stood at -0.37, a relatively low level compared with recent years. The report said rising Treasury volatility often points to tighter financial conditions, but BTC and U.S. stocks have not yet reflected the same degree of risk seen in the bond market.00
U.S. Treasuri2026-09-25 12:58:46Treasury volatility jumps as traders step back from rate betsVolatility in the U.S. Treasury market has surged, with the ICE BofA MOVE Index rising about 29.69% this week, its biggest weekly increase since April last year, according to Odaily. The move came after bond yields climbed to multi-decade highs, shaking the market out of a recent lull. The index has now reached its highest level since March this year, a period the report noted coincided with the outbreak of the Iran war. With price swings intensifying, some market participants are choosing not to add fresh rate exposure for now. Odaily cited Societe Generale rate strategy head Adam Kurpiel as saying his team is neutral on U.S. rates at present and is waiting for volatility to fall before putting on trades again. The latest jump in MOVE points to a bond market that has become notably more unstable in a short period, leaving traders more cautious about near-term interest-rate positioning.00